-
WHAT WE DO
- CLINICAL SOLUTIONS
- SERVICES
-
WHO WE ARE
-
RESOURCES

As clinical studies increase in complexity in a myriad of ways, a key question often asked is, “Is our ability to create complexity increasing faster than our ability to understand complexity?” This is an exciting time to be involved in the reporting of data and metrics on the performance of a clinical study. However, it is important to understand the principles of visual presentation of data to ensure that the information is accessible, actionable, not misleading and ultimately valuable for the end consumer of information
A multitude of roles are involved in a clinical trial such as Clinical Study Leader, Clinical Supply Managers, Statisticians, Country Managers, CRAs/Monitors, and Site Personnel. In product management terms, these roles are considered User Personas. A clear understanding of these roles and the activities they are required to perform by asking the question ‘what problems are you trying to manage?’ provides the framework for identifying the information they need to perform their jobs.
Also important is understanding the lifecycle of a clinical study which, at its broadest, can be considered inception, design, start-up, subject recruitment, study conduct, close out, and submission. These lifecycle steps should be used to influence when information is presented and how its prominence may change over time, depending on the study status. Delivering information that is relevant to the user in alignment with business processes will help ensure that metrics are actionable and used.
There are generally 4 types of metrics that one could measure in the clinical trial industry:
Anecdotally, it would appear that while there is much focus on metrics addressing both cycle time and timeliness, there are fewer that monitor quality and cost within the clinical trial industry. These four elements need to be in balance to ensure that doing something on time does not result in a lot of rework along the way. One of the metrics that is often discussed in Electronic Data Capture (EDC) solutions is the close out rate of queries (i.e., the time taken from when a query is raised until it is resolved). This is a cycle time metric. Although important in a trial, this is measuring rework (i.e., a lack of quality). This is an example of an ineffective resource investment as it does not materially contribute to the outcome of the trial. Conversely, focusing effort on reducing the number of queries raised has twice the impact as it improves quality AND reduces the amount of resources required to do the rework. Focusing in this area is an effective use of resource as it materially contributes to the outcome of the study.
It is essential that these key points remain at the forefront:
Having the right information readily accessible especially for data-intensive clinical trials at the right time and in a format that is easy to understand helps focus on what is important. Without focus it is easy to become distracted and dwell on issues that do not have a positive impact on objectives. Keeping these basic principles in mind when defining metrics and designing how to display them is essential in delivering metrics that are valued by the user.
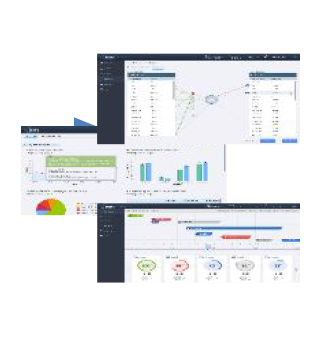
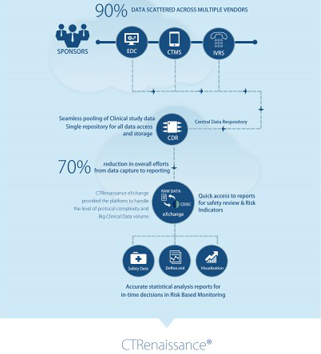
MaxisIT with its cloud based integrated solution brings an opportunity to sponsor to improve oversight of clinical investigations by enabling standardization and storage of data, allowing integration with different EDC,CTMS, Safety, PV, Health Care, and document management systems.
Predictive analytics with dashboard for metrics, key performance indicators, key risk indicators, configurable thresholds, triggers, alerts, escalations and workflows to drive proactive risk mitigation and actionable outcomes are the major features associated with our solution, enabling sponsors to take timely decisions and reassess the monitoring strategy throughout the monitoring cycle.
7 Feb 2018

15 Apr 2022